Pending Sales Broke First, Prices Haven't Caught Up: July 2026 Southern California Seller Market Update
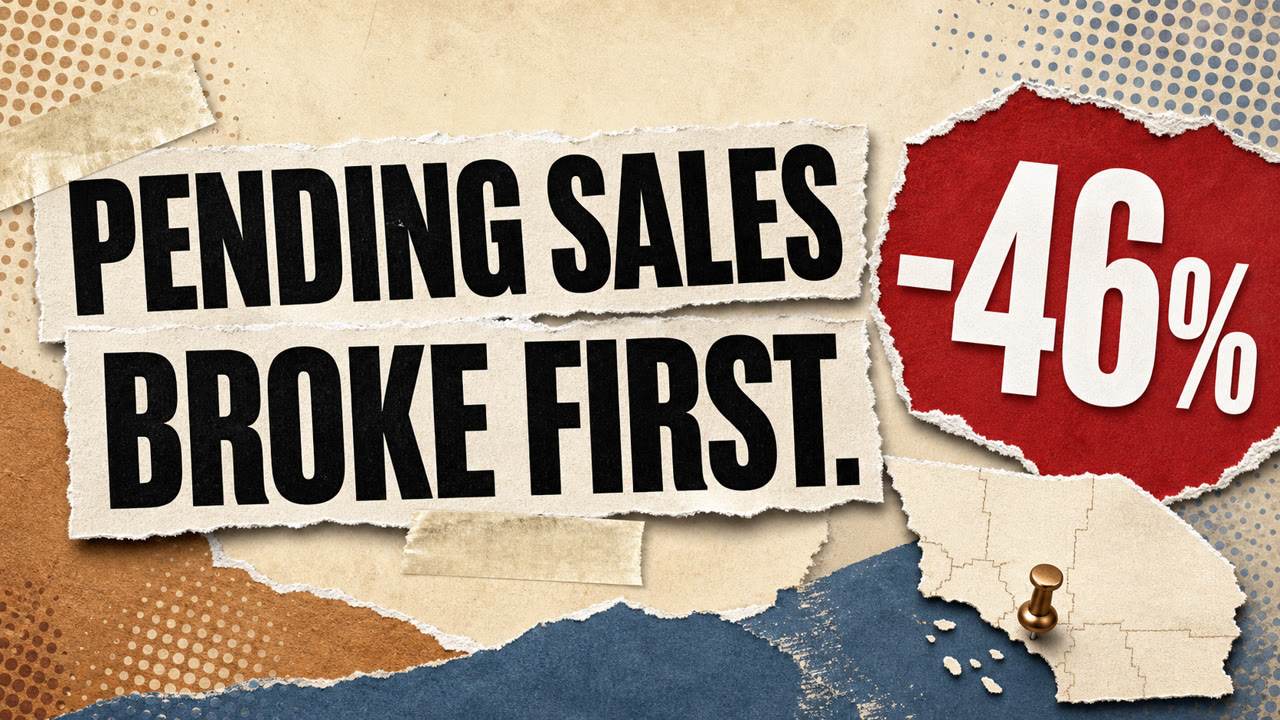
The July snapshot says something sellers need to hear plainly: the demand signal broke before prices did. Pending sales fell across all four counties, Orange County was the largest mover at -46.2%, and prices only moved a little. That is the kind of gap that opens a short pricing window, then closes it fast.
The market is not collapsing. It is separating. If you price to last month, you are already behind the buyers who are active today.
Watch the July 2026 Market Update
Pending Sales Broke First
Pending sales are the forward-looking signal. They tell you what buyers are doing now, not what they already finished doing last month. In July, that signal weakened everywhere.
The snapshot's derived block is blunt: Pending sales fell across all 4 counties; Orange County led at -46.2%. That is the headline, because it says the next wave of closings is likely to come in softer than the last one.
All four counties lost pending demand in July. Orange County posted the biggest drop, followed by Los Angeles, San Bernardino, and Riverside.
Los Angeles County fell to 2,426 pending sales (-38.8%). Orange County fell to 987 (-46.2%). Riverside fell to 1,611 (-29.0%). San Bernardino fell to 1,043 (-30.4%).
Mortgage Rates Are the Fuel Behind the Pullback
You cannot read July's demand signal without the rate number sitting next to it. The 30-year fixed mortgage rate ended July at 6.66% (FRED MORTGAGE30US, week of July 30, 2026). It spent the month grinding up from 6.43% at the start of July, and the direction matters more than the size of each weekly move.
The 30-year fixed rate climbed from 6.43% at the start of July to 6.66% by the week of July 30. FRED MORTGAGE30US, weekly observations.
Here is the part that should shape a seller's expectations: the forward signals do not see relief. The TimesFM mortgage-rate forecast, derived from the same FRED series, holds rates at 6.73% over one month and 6.78% over three months. Prediction markets go further — they price a 0% chance the 30-year drops below 6% before the election, a 77.5% chance it touches 6.75% by the end of the year, and a 47% chance it hits 7.00%.
Put the two together and the picture is not subtle: the affordability squeeze is structural for the rest of the year, not a one-week blip. Sellers who wait for rates to come back down are waiting on something the market itself does not believe is coming.
Prices Held — For Now
Prices did not move with the same force. Los Angeles County was up to $1,396,379 (+1.3%). Orange County was down slightly to $1,649,040 (-0.4%). Riverside County was up to $709,079 (+0.7%). San Bernardino County eased to $588,106 (-0.8%).
That is the problem for sellers who assume last month's comp still defines this week's market. Demand is softer, but prices have not fully caught up yet. That lag is exactly where the first two weeks matter.
Orange County still carries the highest median sales price, but the price chart does not look like the demand chart anymore.
Months Supply Ticked Up
Months of supply is slower to move than pending sales, but the direction still matters. Los Angeles County moved to 4.7 months (+6.8%). Orange County moved to 3.6 months (+9.1%). Riverside County moved to 4.0 months (-4.8%). San Bernardino County moved to 4.8 months (+4.3%).
The point is not to force a broad buyer-or-seller label onto the whole region. The point is that each county is moving differently, and sellers have to price against the county they are actually in.
Supply rose in Los Angeles, Orange, and San Bernardino. Riverside was the only county that moved down on this metric.
The County Split Is the Story
Four counties. Four different reads. The table below is the clean reference point.
| County | Median sales price | Price MoM | Pending sales | Pending MoM | Months supply | Supply MoM | Active listings | Active MoM | DOM | DOM MoM |
|---|---|---|---|---|---|---|---|---|---|---|
| Los Angeles | $1,396,379 | +1.3% | 2,426 | -38.8% | 4.7 months | +6.8% | 17,391 | +3.2% | 38 | +5.6% |
| Orange | $1,649,040 | -0.4% | 987 | -46.2% | 3.6 months | +9.1% | 5,966 | +4.9% | 36 | +16.1% |
| Riverside | $709,079 | +0.7% | 1,611 | -29.0% | 4.0 months | -4.8% | 8,517 | -5.0% | 48 | +2.1% |
| San Bernardino | $588,106 | -0.8% | 1,043 | -30.4% | 4.8 months | +4.3% | 6,694 | +0.3% | 43 | -8.5% |
Orange County still owns the highest price point, but it also posted the largest pending-sales drop. Los Angeles County has the deepest inventory pool and a higher months-supply reading. Riverside County stays the affordability valve. San Bernardino County has the longest supply picture in the group and the lowest price point.
What Sellers Should Do
The right response is not panic. It is precision. You price to the current buyer pool, not to the sales story from a month ago. You take the first two weeks seriously because that is when the market tells you whether your list price is competitive or nostalgic.
If the home is positioned well, the market will show it quickly. If it is priced above the current demand signal, it will sit while better-aligned listings get the attention.
Quick Answers
Why does pending sales matter more than closed sales in July 2026?
Pending sales are the forward demand signal. In July, pending sales fell in every county: Los Angeles to 2,426 (-38.8%), Orange to 987 (-46.2%), Riverside to 1,611 (-29.0%), and San Bernardino to 1,043 (-30.4%). That is the clearest sign that buyer urgency weakened before prices did.
Which county had the biggest demand drop?
Orange County was the largest absolute mover in the snapshot. The derived block shows pending_sales for Orange at -46.2% month over month, which led the region.
Did prices fall as fast as demand?
No. Prices were much steadier than pending sales. Median sales price rose to $1,396,379 in Los Angeles (+1.3%), slipped to $1,649,040 in Orange (-0.4%), rose to $709,079 in Riverside (+0.7%), and eased to $588,106 in San Bernardino (-0.8%).
What should a seller do with the first two weeks on market?
Treat the first two weeks as the pricing window that matters most. July shows buyer demand weakening while prices have not fully adjusted, so sellers who price to current demand keep leverage instead of chasing the market down.
Are mortgage rates going to come back down soon?
The forward signals do not point to quick relief. The 30-year fixed rate was 6.66% in the week of July 30, 2026. The TimesFM forecast holds it near 6.73-6.78% over the next one to three months, and prediction markets price a 0% chance of it falling below 6% before the election. Waiting for a rate drop is a bet the market itself is not making.
Which county still has the strongest price point?
Orange County still has the strongest median sales price at $1,649,040, but that strength is not the same as demand. The county also posted the steepest pending-sales drop, so price and buyer traffic are no longer moving together.
Source Note
Market figures in this article come from the July 2026 Southern California market snapshot using CRMLS/Infosparks data. The canonical data-through date is 2026-07-31.
Paul Fernandez, REALTOR®, advises Southern California home sellers on pricing, timing, and market data. CA DRE #01835505.